University of Tartu’s greenhouse gas footprint 2019–2024
The University of Tartu (UT) is committed to complying with the UN Sustainable Development Goals, including implementing measures to curb climate change. An organisation’s climate impact (contribution to climate change) can be assessed according to the total amount of greenhouse gas (GHG) emissions it produces directly or indirectly during its activities. Emissions are measured in tonnes of CO2 equivalent (tCO2eq). It should be remembered that climate change is just one of the sixteen categories used in the environmental footprint calculation method developed by researchers.
UT calculated its recent years’ GHG footprint for the first time in 2024. This involved developing a suitable methodology for the university to estimate GHG emissions and collect and analyse the necessary data.
The methodology of calculating the university’s GHG footprint was compiled based on:
- Guidance for GHG footprint assessment, commissioned by the Ministry of the Environment and prepared under the above standards under the leadership of the Tallinn Centre of the Stockholm Environment Institute (in Estonian),
- Guidance document Standardised Carbon Emissions Reporting Framework – Version 3.0 – December 2022, prepared by the Environmental Association for Universities and Colleges (EAUC), UK and Ireland.
In the calculations, mainly emission factors from the following sources were used:
- Guidance for GHG footprint assessment, ch. 7. Annexes. Specific emission factors for calculating GHG footprint (in Estonian);
- Specific emission factors for GHG footprint assessment 2022;
- GHG emission factors database of the UK Department for Energy Security and Zero Energy (formerly DEFRA);
- US Environmental Protection Agency’s (EPA) database of GHG emission factors for procurement and supply chain.


The GHG footprint calculation includes, if data are available, the seven main greenhouse gases (carbon dioxide (CO2), methane (CH4), nitrous oxide (N2O), hydrofluorocarbons (HFCs), perfluorocarbons (PFCs), sulphur hexafluoride (SF6), nitrogen trifluoride (NF3)). The GHG emission activities and sources are conventionally grouped under three scopes, each comprising further categories representing the factors causing the most GHG emissions from the institution’s activities (see Figure 1). In addition, a distinction is made between upstream and downstream emissions; the former relates to products and services supplied to the institution and the latter to products and services sold by the institution itself.
For scopes 1 and 2, a quantity-based method is used for calculations. For scope 3, the cost-based method is applied for products and services and a hybrid method for business travel and commuting.
UT’s GHG footprint calculation covers the activities of the university’s four faculties, including colleges (Narva College, Pärnu College, Viljandi Culture Academy) and institutions and support units, University of Tartu Academic Sports Club, Tartu Student Club and Tartu Student Village. The analysis does not include companies in which the University of Tartu has a shareholding.
Indicators for 2019–2023 and forecast for 2024
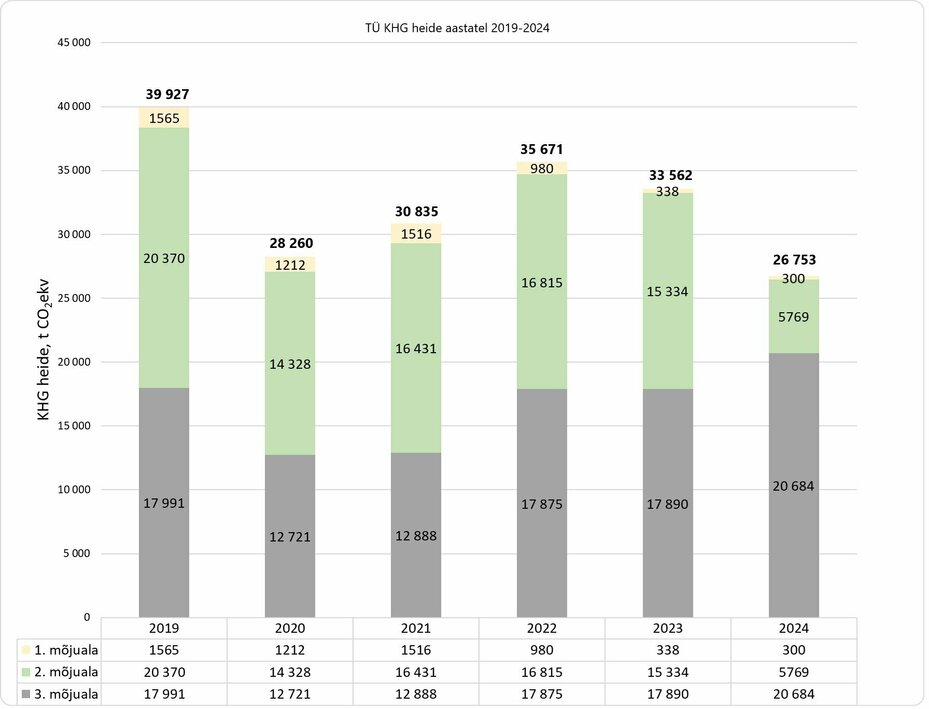
To find a suitable base year to compare the impact of future climate measures at the university, a comparison was made of the years from 2019 to 2022. This enabled us to understand, among other things, the effect of the Covid-19 pandemic and the Russian aggression in Ukraine on GHG emissions. Later, calculations for 2023 and the forecast for 2024 were added (see Figure 2), and the values of specific emission factors in the calculations were updated. The results of the calculations confirmed that the most appropriate base year was 2019 when no direct or indirect effects of the war and the pandemic were present (lower consumption of goods and services, smaller number of business trips).

The largest share of the university’s GHG emissions is from electricity consumption in scope 2 (43–45% of the university’s GHG emissions). However, the procurement of electricity from renewable sources at the end of 2023 will significantly reduce GHG emissions in 2024, as the university switched to the renewable electricity package as of 1 March. Scope 3 accounts for 45–49% of total emissions. While the transition to renewable electricity (scope 2) helps reduce emissions in 2024, it will be necessary to review the choices made in building the infrastructure, purchasing products and contracting services to reduce the climate impact in the future.
The proportion of scope 1 in the GHG footprint is small, between 3–5%. In 2023, it decreased further, and the same trend can be observed in 2024, as the university has stopped using natural gas for heating its buildings and switched to district heating. The switch to district heating has not significantly increased scope 2 emissions, as the heating company providing the service in Tartu and Pärnu has increased the share of biomass in their fuel mix year on year, thus reducing the value of the emission factor applied.
Comparison with other universities
Other larger universities in Estonia have also assessed their GHG footprint. However, the values presented in table 2 do not allow detailed comparison as universities apply different methodologies to estimating their GHG emissions.

1 https://taltech.ee/rohepoore/kliimanutikas-ulikool
2https://www.tlu.ee/meediavarav/blogid/selgus-tallinna-ulikooli-susiniku-jalajalg
When comparing the results of the universities’ GHG footprints by scopes 1–3, a similar pattern emerges: a substantial part of the emissions results from electricity and heating of the universities’ research and teaching infrastructure, transport (members’ mobility business travel, transport of services and goods), and consumption of services and goods.
The university has worked to reduce its climate and environmental impact already before calculating its GHG emissions and will continue implementing projects and planning new ones. The university will also continue work on updating and completing its GHG footprint calculation model and specifying the emission factors.
The shows a summary of the report comparing the years 2019–2023; the full document is available on the intranet (in Estonian).


